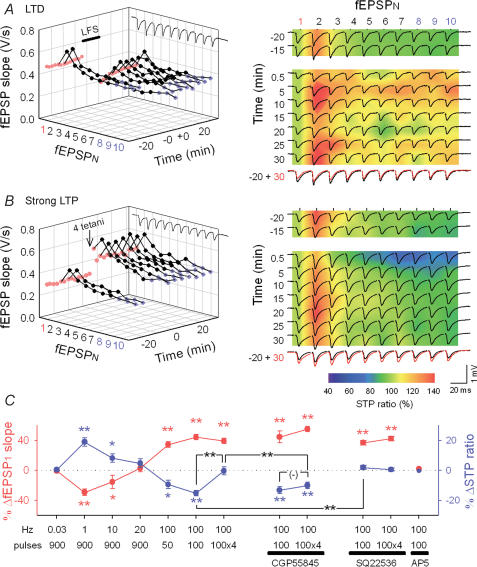
Figure 4. Activity-dependent, bidirectional RSE.
A and B, representative STP changes induced by 900 pulses at 1 Hz (A), or four 100 pulses at 100 Hz (B). Time courses of fEPSP slopes are plotted in the left panels. The right panels indicate 10 fEPSP slopes normalized to fEPSP1 in each train on a pseudocolour scale, on which raw field responses were superimposed. The bottom-right panels merge two traces 20 min before and 30 min after LFS or tetanus. D, summary of bidirectional synaptic plasticity and RSE. Changes in fEPSP1 (red) displayed a BCM-like sigmoid curve (Bienenstock et al. 1982), and they were correlated inversely with the mean changes in fEPSP8–10 relative to fEPSP1 in each train (ΔSTP ratio, blue), except for four tetani (100 pulses at 100 Hz), which did not alter the STP ratio. In the presence of 1 μm CGP55845, however, four tetani decreased the STP ratio to a degree similar to that after one tetanus-induced LTP. In contrast, one tetanus-induced RSE was blocked by 100 μm SQ22536. AP5 blocked the induction of both LTP and RSE. Data were obtained 15 min before and 30 min after tetanus. *P < 0.05, **P < 0.01 versus basal response; Tukey's test (n = 5–8 slices).

