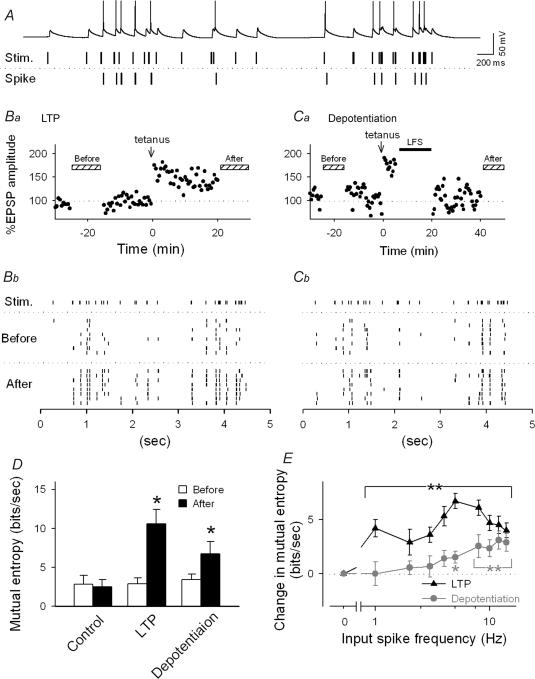
Figure 11. RSE modifies a frequency preference in spike responses.
A, upper trace: typical spiking activity generated by a CA1 pyramidal cell in response to a stimulus train with a natural temporal pattern (middle trace) sampled from a CA3 pyramidal cell in a free-moving rat. Bottom trace: extracted spikes. B–C, representative firing responses 20 min before and 30 min after induction of LTP (B) or depotentiation (C). Ba and Ca show the time courses of changes in EPSP1 evoked by single-pulse test stimulation in a current clamp mode. Rasterplots (Bb and Cb) show timings of spikes evoked by the same natural stimulus trains. The trains were applied 8 times every 60–120 s during the periods indicated by the hatched bars in the panels Ba and Ca. D, quantification of information transmitted from presynaptic to postsynaptic sites before and after induction of LTP and depotentiation. Mutual entropy enhanced by LTP was retained after depotentiation. E, frequency-dependent information transmission. At depotentiated synapses, the mutual entropy was increased in a frequency-specific manner (grey) whereas synapses with LTP displayed a broad increase (black). *P < 0.05, **P < 0.01 versus basal response; Tukey's test (n = 3–6 slices).

