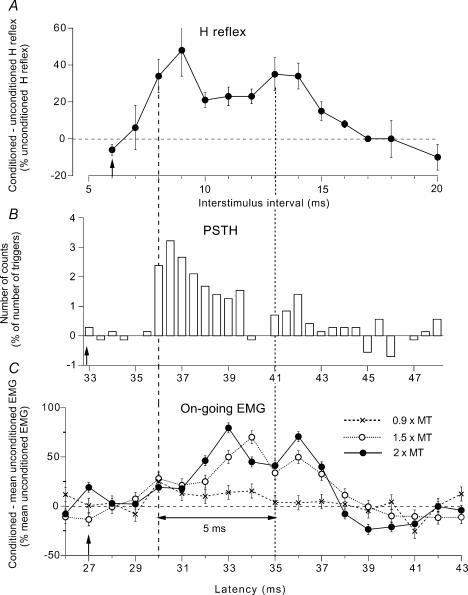
Figure 1. Three measures of modulation of responses of quadriceps (Q) motoneurones following stimulation of the deep peroneal (DP) nerve.
A–C, changes produced in the same subject (same experiment) by DP stimulation (at 1.5 × MT, A, B and C○) during a weak (∼3% of MVC) tonic Q voluntary contraction in the sitting position. A, difference between conditioned and unconditioned H reflexes (expressed as a percentage of unconditioned H reflexes) plotted against the conditioning-test (interstimulus) interval between DP and femoral nerve (FN) stimuli (unconditioned H reflex set at 18% of Mmax). Each symbol represents the mean (± s.e.m.) of 20 responses. B, changes in firing probability of a single motor unit (after subtraction of the background firing, 0.5 ms bin width), with the number of counts expressed as a percentage of the number of triggers, plotted against the latency after DP stimulation. C, changes in the rectified and averaged (mean ± s.e.m. of 150 sweeps) on-going EMG (difference between conditioned and mean unconditioned EMG expressed as a percentage of the mean unconditioned EMG) plotted against the latency after DP stimulation. Results obtained with stimulation at 2 (•) and 0.9 (×) × MT are also shown. Vertical dashed and dotted lines, estimates of the beginning of the early and late facilitation, respectively, separated by 5 ms (double-headed horizontal arrow). Distances from stimulation sites to the spinal cord (L2 vertebra) were 0.70 m (DP) and 0.25 m (FN). At conduction velocities of 67 and 58 ms−1 for DP and FN Ia volleys, respectively, the resulting difference in afferent conduction times for the fastest Ia volleys in the two nerves was 6.1 ms ([0.70/68 = 10.4 ms]–[0.25/58 = 4.3 ms]). Latencies of the Q H reflex 21 ms, and of the homonymous monosynaptic Ia peak in the PSTH 27 ms (because of the trigger delay of the unit, 6 ms). Expected time of arrival of the DP Ia volley at motoneurone level (0 central delay, vertical arrows) 33 ms (27 + 6.1) in the PSTH (B), 27 ms (21 + 6.1) in the on-going EMG (C), and corresponding to the 6 ms interstimulus interval for the H reflex (A).

