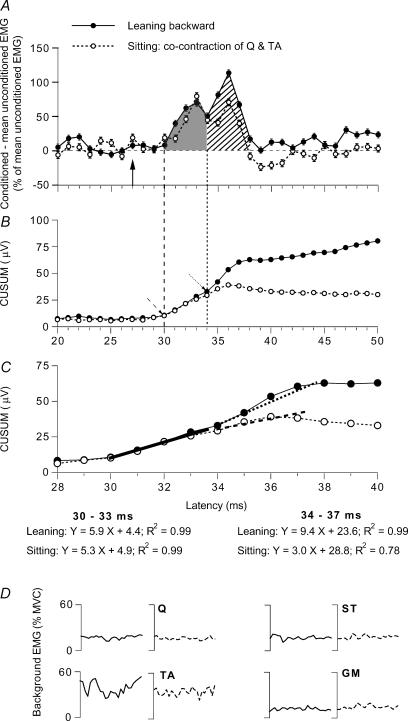
Figure 2. Modulation of the on-going Q EMG while leaning backward and while sitting.
Data for one of the subjects. A–C, changes in the rectified and averaged on-going Q (VC) EMG (A) and corresponding CUSUMs (B and C) after DP stimulation (2 × MT) while leaning backward (•) and during tonic voluntary cocontraction of TA and Q in sitting (○; same subject as in Fig. 1, but stronger Q contraction at 20% of MVC). A, difference between conditioned and mean unconditioned EMG, expressed as a percentage of the mean unconditioned EMG (mean ± s.e.m. of 100 sweeps) plotted against the latency after DP stimulation, with early (grey area) and late (hatched area) excitation. B and C, CUSUMs (in µV, because they were calculated from the raw data without amplification) of the data illustrated in A. B, CUSUM with the same abscissa as in A, i.e. the first bins of the CUSUM (starting 13 ms after DP stimulation, see Methods) are not shown. Dashed and dotted oblique arrow, onset of early and late facilitation, respectively. C, same data as in B with an expanded scale for the abscissa. Linear regressions have been drawn between 30 and 33 ms (thick continuous line) and 34 and 37 ms (dotted line, leaning backward; dashed line, cocontraction in sitting position): the resulting models of the regressions and the coefficients are shown beneath panel C in the two situations (‘leaning’ and ‘sitting’). Vertical arrow (A, 27 ms) and vertical dashed and dotted lines (A and B) as in Fig. 1. D, background rectified and averaged (100 sweeps) on-going EMG in Q, ST, TA and GM (as a percentage of MVC, 25–50 ms after DP stimulation) recorded during the same experiment while leaning backward (continuous lines) and during sitting on a high stool (dotted lines).

