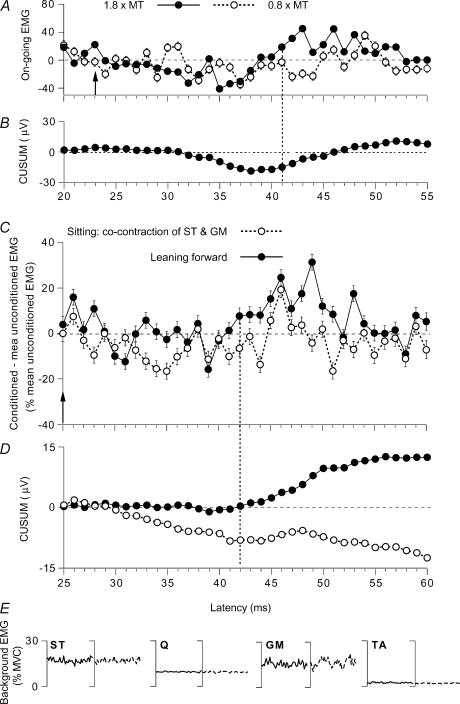
Figure 4. Modulation of the on-going semitendinosus (ST) EMG while leaning forward and while sitting.
Data for individual subjects. A–D, changes in the rectified and averaged on-going ST EMG (A and C, difference between conditioned and mean unconditioned EMG, expressed as a percentage of the mean unconditioned EMG, mean ± s.e.m. of 100 sweeps) and corresponding CUSUMs (B and D, raw data without amplification, in µV) after GM stimulation. A and B and C–E, data from two different subjects. A, effects of GM stimulation set at 1.8 (•) and 0.8 (○) × MT during tonic voluntary contraction (14% of MVC) in sitting position. B, CUSUM of the data illustrated in A after stimulation at 1.8 × MT. C, modulation of the on-going ST EMG by a GM stimulation at 1.3 × MT while leaning forward (•) and during tonic voluntary cocontraction of GM and ST in sitting position (○). D, CUSUMs of the data illustrated in C. Vertical arrow (A, 23 ms; C, 25 ms), expected time of arrival of the GM group I volley at spinal level. Vertical dotted line (A, 41 ms; C, 42 ms), beginning of the EMG facilitation. E, background rectified and averaged (100 sweeps) on-going EMG in ST, Q, GM and TA (as a percentage of MVC, 25–50 ms after GM stimulation) recorded during the same experiment while leaning forward (continuous lines) and during sitting on a high stool (dotted lines).

