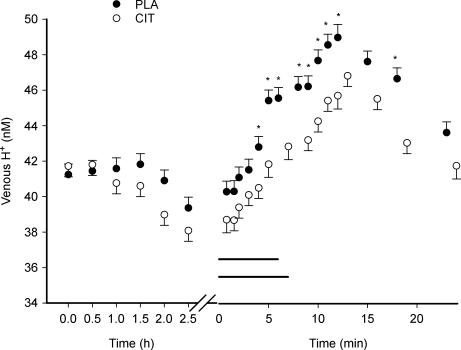
Figure 2. Venous H+ concentration during ingestion, exercise and recovery from exercise.
The x-axis is broken into two segments: ingestion (ingestion at time 0, time axis in hours) and exercise/recovery (time axis in minutes). The last value during exercise represents the mean value at exhaustion. The horizontal lines represent the exercise period in CIT and PLA. *Significant difference between CIT and PLA values. The values represent mean ± s.e.m. (n = 7).

