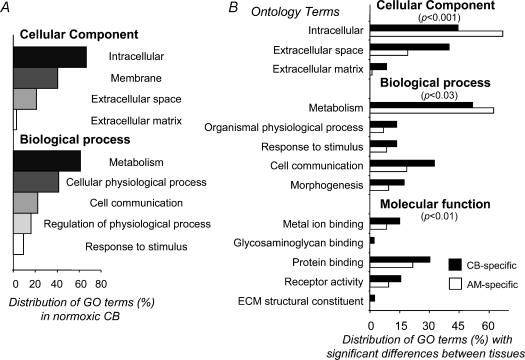
Figure 1. Gene ontology comparisons of CB and AM gene expression under normoxic conditions.
A, general ontology classification of CB-expressed genes in two ontology terms. B, comparisons of GO distributions among CB and AM-specific genes. The P-values calculated for each comparison represent the statistical significance of the paired distributions, as evaluated with Fisher's exact test for 2 × 2 contingency tables with a P-value adjusted for multiple testing using the FDR procedure (Reiner et al. 2003). Only those GO terms with significant differences (P < 0.05) are shown in the figure.

