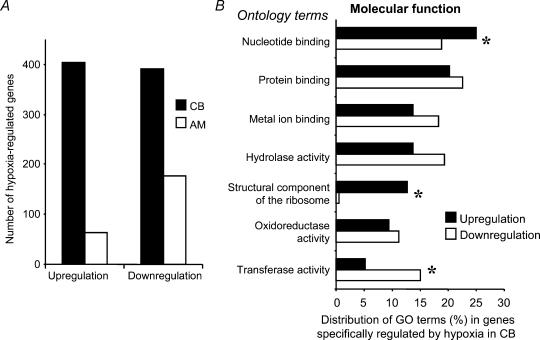
Figure 2. Changes in CB gene transcription under 10% O2 hypoxia.
A, comparison of the total number of genes regulated by hypoxia between CB and AM. B, gene ontology classification of genes regulated by hypoxia specifically in the CB. The main ontology classes based on molecular function are represented separately as up-regulated or down-regulated gene groups. Statistically significant (P < 0.05) differences in some gene ontology groups are marked by asterisks.

