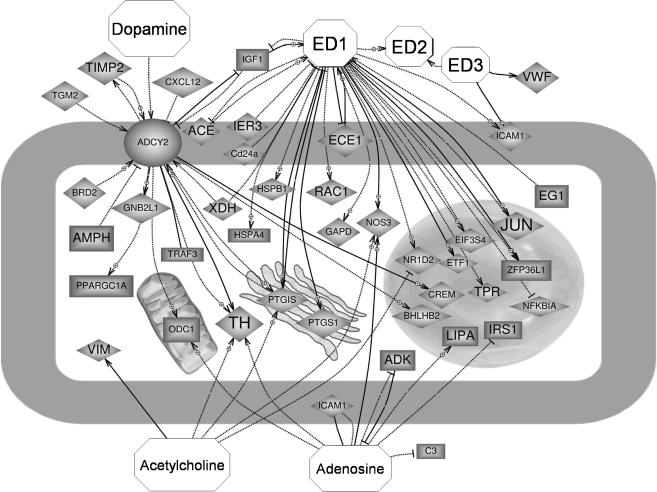
Figure 3. Functional interactions among genes specifically regulated in the CB under physiological hypoxia with molecules (octagons) known to be released by type I cells upon hypoxic activation.
Up-regulated genes are shown as diamonds and down-regulated ones as rectangles. Dashed and continuous lines represent different ways of molecular interaction. Arrows point to positive regulation, while blunt-end lines reflect negative regulation. Gene names and references to interactions shown can be found in the Supplemental material. Other networks are also attached as Supplemental material.

