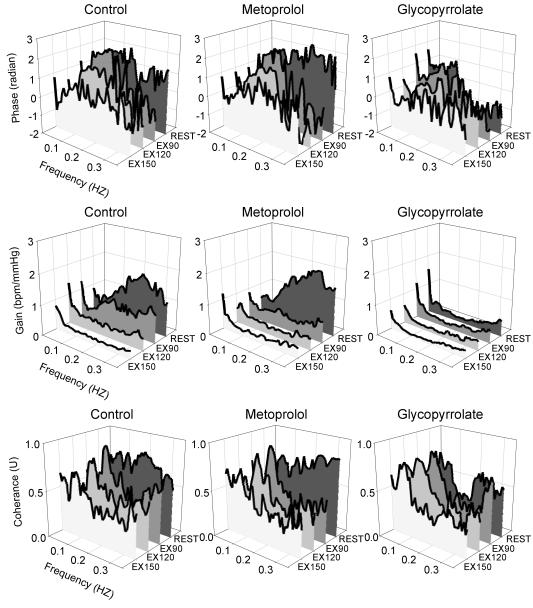
Figure 4. Group-averaged (n = 8) transfer function phase, gain and coherence between HR and MAP.
The transfer function phase (top), gain (middle) and coherence (bottom) between HR and MAP in the frequency range from 0 to 0.35 Hz at rest and during mild (EX90), moderate (EX120) and heavy (EX150) exercise under control (left), with metoprolol (middle) and glycopyrrolate (right) conditions.

