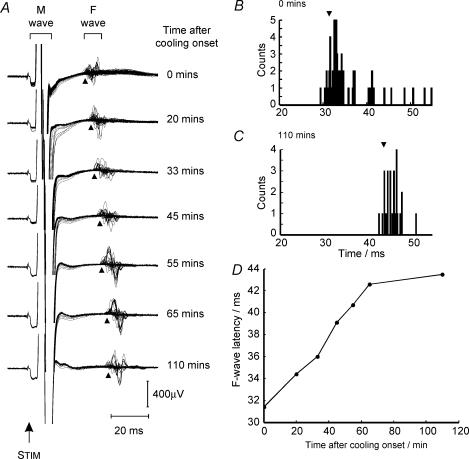
Figure 1. Change in F-wave latency during arm cooling in a single subject.
A, F-waves elicited by stimulation of the median nerve at the wrist at different times after the onset of cooling. Each trace shows 30–40 superimposed sweeps. M-wave clipped for clarity. Arrowheads mark the 10th percentile F-wave onset latency. STIM, point of stimulus delivery. B and C, histograms of F-wave latency at the start (B) and end (C) of cooling. Arrowheads indicate the 10th percentile of the latency distribution. D, 10th percentile of F-wave latency plotted against time after cooling onset. Subject 2tt.

