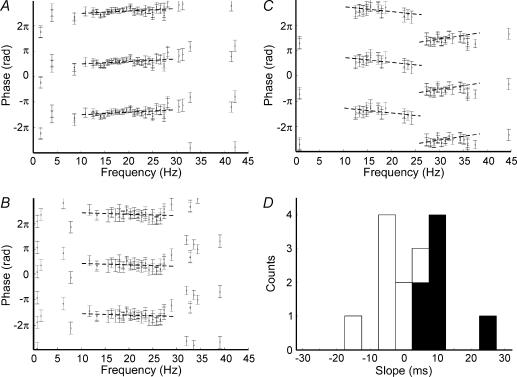
Figure 3. Phase slope grouping method.
Plots (A–C) are single-subject examples of coherence phase versus frequency. Phase estimates from each of the three intrinsic hand muscles have been superimposed. Each point is plotted three times at phases separated by 2π radians, to allow linear trends to be visualized across cycle boundaries. Points are only shown for frequencies with significant coherence. Error bars show 95% confidence limits. Broken lines show linear regression fit. A, subject 2rd, with a phase–frequency regression slope significantly different from zero. B, subject 8cnr with regression slope not significantly different from zero. C, subject 2kb showed a zero-slope relationship for low frequencies of coherence, but a significantly non-zero slope at higher frequencies. D, histogram of delays between EEG and EMG calculated from regression slopes in all subjects. Positive delays indicate EEG leads EMG. Black bars show slopes significantly different from zero.

