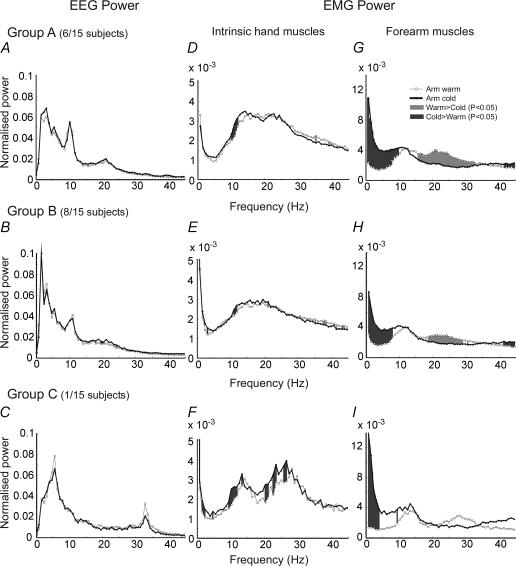
Figure 5. The effect of arm cooling on EEG and EMG power spectra averaged across subjects in each group.
A–C, EEG power. D–F, full-wave-rectified EMG power averaged over intrinsic hand muscles. G–I, full-wave-rectified EMG power averaged over forearm muscles. A, D, G, Group A subjects. B, E, H, Group B subjects. C, F, I, anomalous subject not classified into either group. In all panels, thin line shows control data with arm warm; thick line after cooling. Grey shading marks bins where cooling significantly changes the measure (P < 0.05).

