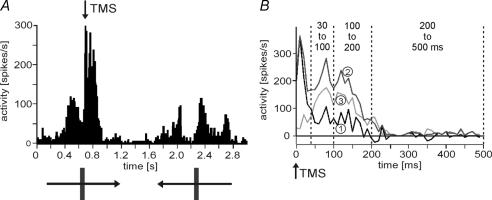
Figure 1. Analysis of paired-pulse transcranial magnetic stimulation (ppTMS) effect on visually evoked activity.
A, peristimulus time histogram (PSTH) showing single-unit activity evoked by an optimally orientated bright bar moving back and forth across the receptive field of the unit as indicated by the drawing below the diagram. TMS was given close to visually enhanced activity (see arrow). B, mean activity within a time window of 500 ms following TMS (time of suprathreshold test stimulus (TS), the second stimulus in the case of ppTMS). Curves 1–3 are: (1) activity after TS only, (2) activity following ppTMS (in this case a conditioning stimulus (CS) of 60% strength of TS, given 4 ms prior to TS), (3) difference between curves 1 and 2 (2 minus 1). Activity rates were calculated as the mean of 20 identical trials. Three different time windows following TMS were analysed (as indicated by the dashed lines): 30–100 ms, 100–200 ms and 200–500 ms. For further analysis, the activity within these time windows was averaged for each condition.

