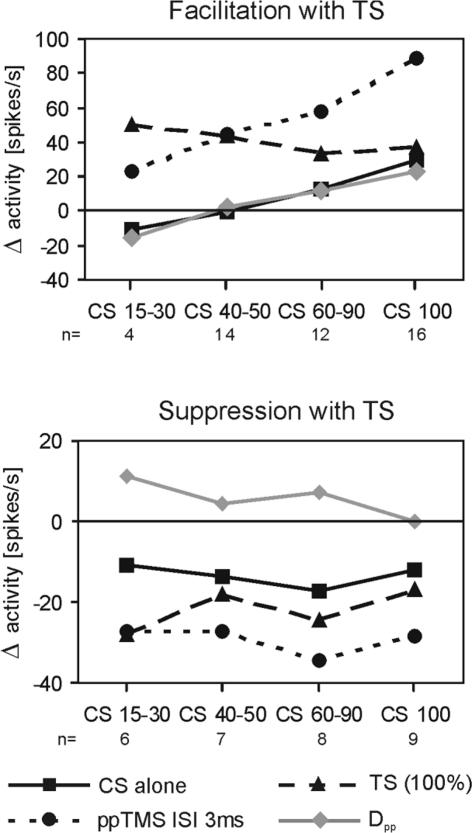
Figure 5. ppTMS effect versus the sum of CS and TS effect.
For 25 neurones in which at least 2 CS strength effects have been recorded, the mean effects of single CS of different strength are compared with the mean effects of TS alone, ppTMS with 3 ms and the difference between ppTMS effect and the sum of the individual CS and TS effects (Dpp =Δvis, ppTMS– (Δvis, CS+Δvis, TS)). The upper diagram shows the mean values for those 16 cells in which the TS caused facilitation of visual activity; the lower diagram shows the means of 9 cells with TS suppression.

