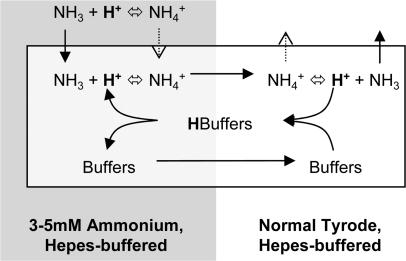
Figure 1. Schematic diagram of dual microperfusion: the computational model.
Sarcolemmal and intracellular fluxes of solutes, as well as reaction events, are illustrated during partial exposure of a myocyte to small doses of NH4Cl (3–5 mm). The result is an end-to-end pHi gradient, as intracellular protonation of ammonia raises pHi locally (by 0.1–0.6 pH units). Note that, because of buffering, the spatial diffusion of free H+ is insignificant, all proton movement being via buffers (e.g. Vaughan-Jones et al. 2006). Sarcolemmal acid/base transporters are not included in the model, but it appears their effect on the pHi gradient is negligible (Swietach et al. 2005a). The computational model is used to generate look-up-tables for apparent intracellular proton diffusion coefficient (DappH) as a function of the amplitude of the pHi gradient for a given mean pHi (see Methods).

