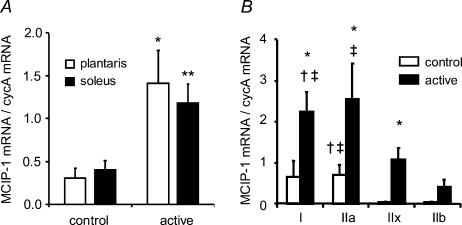
Figure 4. Quantitative analysis of MCIP-1 mRNA levels by real-time RT-PCR in whole plantaris and soleus muscles (A) and in plantaris single fibres (B) of control non-exercised and active rats (arbitrary units).
For n and categorization of fibres see Figs 1 (A) and 2B (B). Data are means ± s.e.m.*Significantly different from control values (P < 0.05); **significantly different from control values (P < 0.01); †significantly different from IIx in the same group (P < 0.05); ‡significantly different from IIb in the same group (P < 0.05).

