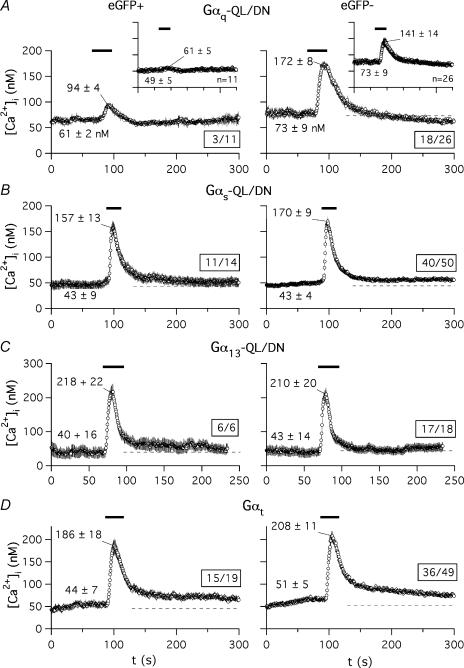
Figure 2. Effect of dominant-negative Gα subunits or Gαt expression on Ca2+ liberation from GH3 cell intracellular stores in response to TRH.
The time course of variations in [Ca2+]i levels is shown for Fura-2 loaded cells from a microscope field transfected with Gαq-QL/DN (A), Gαs-QL/DN (B), Gα13-QL/DN (C), or Gαt (D). Addition of 1 μm TRH is indicated by horizontal lines on top of the traces. Continuous traces averaged point by point and their corresponding s.e.m. are shown. Averaged basal levels are signalled by dashed lines. Data correspond to cells showing fluorescence of the transfection marker (eGFP+, left) or not (eGFP−, right). Variations of [Ca2+]i levels in the cell subpopulations showing a detectable peak Ca2+ increase after visual inspection are illustrated. In all cases the number of averaged cells with respect to the total number of cells present in the field is boxed. Data from the whole cell population present in the microscope field are shown in the insets of panel A. Averaged values from all data points before TRH addition and that of the initial maximum are indicated. Analogous results were obtained in two additional experiments.

