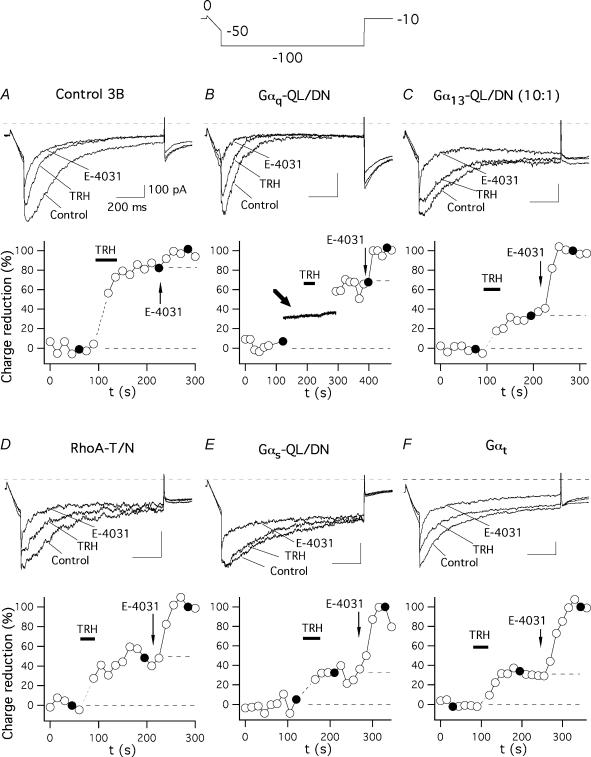
Figure 3. Effect of dominant-negative Gα subunits and Gαt on TRH-induced inhibition of endogenous r-ERG currents in GH3 cells.
The time course of relative r-ERG current reduction by TRH and E-4031 is shown for six different cells transfected with vector pcDNA3B (A), or with plasmids encoding the dominant-negative mutants of Gαq (B), Gα13 (C), RhoA (D) and Gαs (E), or the α subunit of transducin (F). Currents were recorded during 1 s hyperpolarizing pulses to −100 mV from a holding potential of −10 mV. The hyperpolarization step was preceded by a 100 ms ramp from 0 to −50 mV (Gómez-Varela et al. 2003b). Current estimations were performed from total inward charge during the hyperpolarization steps at −100 mV as described in Methods. Averaged charge values before any addition and those corresponding to the minimum following addition of 5 μm E-4031 were considered as 0 and 100%, respectively. Filled circles correspond to the current traces shown above. The first one or two data points following addition of TRH, when total inward currents become transiently enhanced by activation of Ca2+-dependent K+ channels due to massive liberation of Ca2+ from intracellular stores, have been deleted for clarity. Perfusion of 1 μm TRH and addition of E-4031 to the recording chamber are indicated. Values for the data in the absence and presence of TRH are indicated by horizontal dashed lines in the time courses. A continuous membrane current recording at a holding potential of −30 mV around the time of hormone addition is shown in B and marked with a thick arrow. Note the total absence of transient Ca2+-dependent K+ currents following TRH addition in the same cell showing a clear reduction of r-ERG currents. Similar results were obtained in the five additional cells expressing Gαq-QL/DN.

