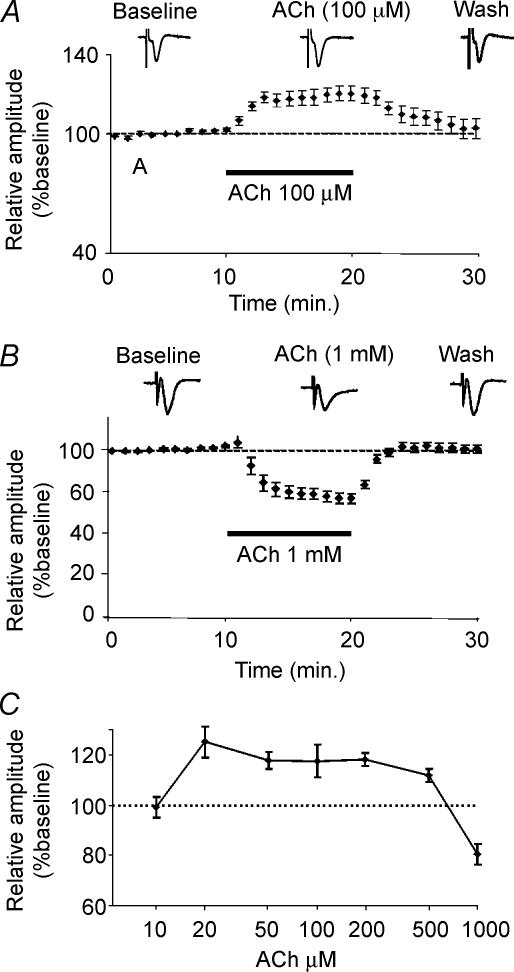
Figure 1. ACh modulates the amplitude of FPs in layer II/III of mouse (SLJ–C57BL/6J) visual cortex during stimulation of WM.
A, bath application of 100 μm ACh induces an increase of FP amplitudes that return to baseline after washout (n = 15, symbols represent the mean relative values ± s.e.m.). B, bath application of 1 mm ACh induces a decrease in amplitude of FPs that returns to baseline after washout (n = 15, symbols represent the mean relative values ± s.e.m.). C, concentration–response curve of ACh bath application (20 μm, n = 5; 50 μm, n = 6; 100 μm, n = 15; 200 μm, n = 6; 500 μm, n = 7). Horizontal bars depict the period of application of ACh. Inset: representative traces. Calibration bar = 0.2 mV/5 ms. In C circles represent the mean amplitude of FPs during the last three minutes of ACh application normalized with respect to the mean FP amplitudes during the last three minutes of baseline (s.e.m. is shown as a vertical bar for each symbol).

