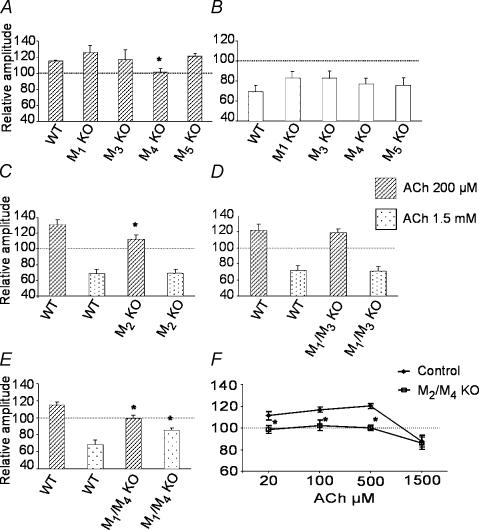
Figure 4. Modulatory effects of ACh on FPs elicited in visual cortex slices from M1–M5 mAChR KO mice.
A, bath application of 200 μm ACh. Facilitation of FPs was absent in M4 KO mice while it was retained in M1, M3 and M5 KO mice (WT, n = 10; M4 KO, n = 7; M3 KO, n = 8; M5 KO, n = 8; mean FP amplitudes were significantly different between M4 KO and WT mice). B, bath application of 1.5 mm ACh. Depression of FPs was not affected in M1, M3, M4, and M5 KO mice (WT, n = 7; M1 KO, n = 6; M2 KO, n = 7; M3 KO, n = 5; M4 KO, n = 6; M5 KO, n = 7; mean FP amplitudes were not significantly different between KO and WT mice). C, M2 KO mice showed a significant decrease of facilitation induced by 200 μm ACh (WT, n = 6; M2 KO, n = 8; mean FP amplitudes were significantly different between KO and WT mice). Depression of FPs induced by 1.5 mm ACh was normal in M2 KO mice. D, M1/M3 double KO mice showed normal facilitation and depression of synaptic transmission after bath application of ACh at different concentrations (200 μm and 1.5 mm) (M1/M3 WT, n = 10; M1/M3 KO, n = 10; mean FP amplitudes were not significantly different between KO and WT mice). E, M1/M4 double KO mice showed a significant decrease of FP depression induced by 1.5 mm ACh (M1/M4 WT, n = 6; M1/M4 KO, n = 6) and absence of facilitation induced by 200 μm ACh (M1/M4 WT, n = 8; M1/M4 KO, n = 5). F, concentration–response curves in M2/M4 double KO and WT mice. In KO animals, FP facilitation was absent at all ACh concentrations, while depression was induced only by 1.5 mm ACh; the amplitude of FPs was not significantly different between KO and WT mice (see also Table 1).The different KO animals were compared with their corresponding WT mice having the same genetic background (see Methods). Columns in (A–E) and symbols in (F) represent the mean amplitude of FPs during the last 3 min of ACh application, normalized with respect to the mean amplitude of FPs during the last 3 min of baseline. s.e.m. is shown as a vertical bar. *P < 0.05.

