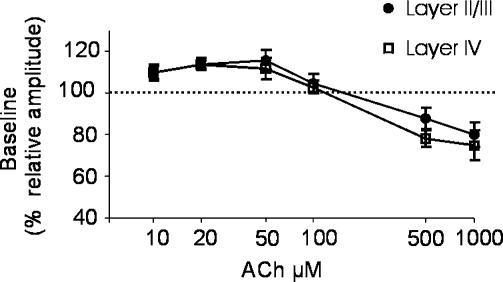
Figure 6. ACh modulation of FPs elicited in visual cortex slices via stimulation of intracortical pathways.
ACh concentration–response curve of FP elicited by stimulation of layer II/III (•) or layer IV (□). Symbols represent the mean relative amplitude of FPs during the last three minutes of ACh application, normalized with respect to the mean FP amplitudes during the last 3 min of baseline s.e.m. is shown as a vertical bar for each symbol.

