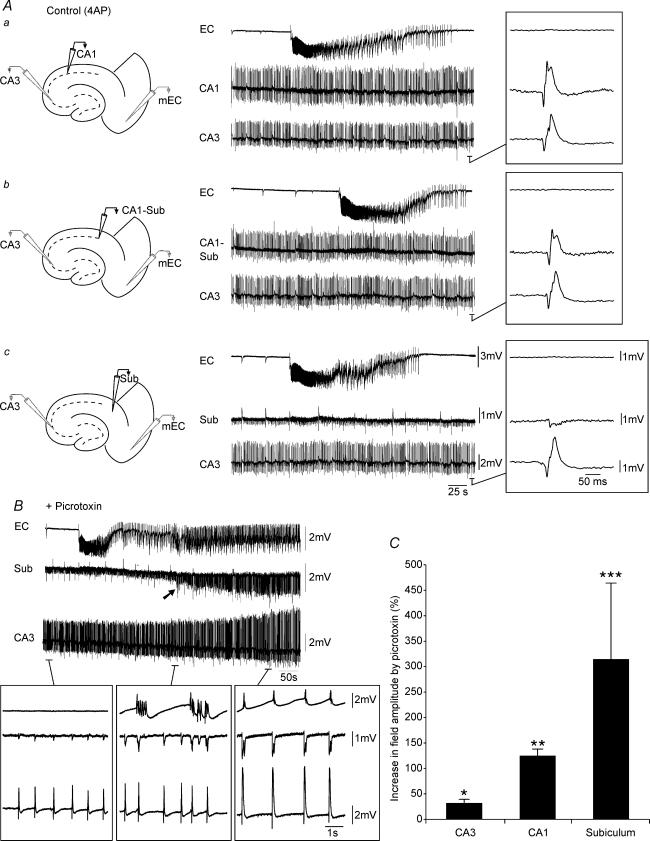
Figure 2. Picrotoxin-induced augmentation of field amplitudes in CA3, CA1 and subiculum.
A, sequential field potential recording along the CA3–CA1–subiculim (Sub)–EC axis under control (4AP) conditions. Field electrodes in CA3 and EC were kept at the same position whilst a third electrode was moved along the stratum pyramidale to CA1 (a), CA1–Sub border (b) and Sub (c). Note the diminished field activity recorded in the subiculum as compared to CA1 and CA1–subiculum. B, monitoring field potential activity in EC, subiculum and CA3 from the onset of picrotoxin application until complete synchronization of the limbic structures. Note that initially CA3-driven interictal discharges do not propagate to the EC (left lower inset), but that following potentiation of subicular network activity (arrow), CA3-driven interictal events can propagate to the EC (right lower inset). Also note that potentiation in subicular activity precedes hippocampus–EC synchronization (middle versus right inset). C, bar graph of the normalized increase in field potential amplitude recorded in different areas of the slice; note that the most drastic potentiation occurs in the subiculum.

