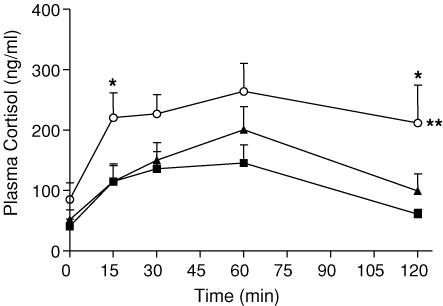
Figure 5. Plasma cortisol concentrations.
Plasma cortisol concentrations (mean ± s.e.m.) in response to an ACTH (2.0 μg kg−1) challenge in male offspring born to mothers that were left undisturbed throughout pregnancy (control, ▪), exposed to a strobe light on GD50–52 (PS50, ▴) or GD60–62 (PS60, ○). ACTH was administered after the time 0 blood sample was taken. Number of animals ranges from 6 to 9. **P < 0.01, PS60 response over time versus control, *P < 0.05 PS60 versus control at a specific time point.

