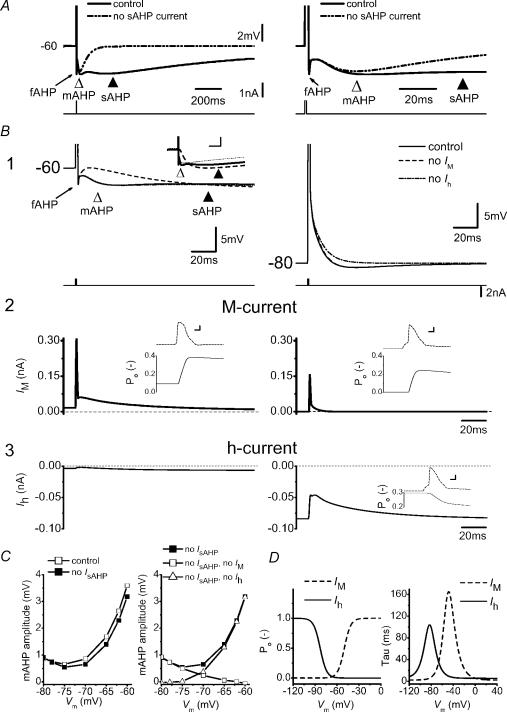
Figure 11. Modelling study of the mAHP following a single AP.
A, a single AP evoked by a current pulse (1 ms) while holding the membrane potential at −60 mV by steady-state current. Simulations were repeated with and without sAHP current. The left- and right-hand panels show the same simulations at different time scales. B1, same protocol as A while holding the membrane potential at different levels, as indicated. Superimposed voltage responses of simulations are shown of ‘control’ or with either ‘no Im’ or ‘no Ih’. B1, inset, (at a different scale) the AHPs following a single spike evoked at −60 mV, in normal conditions (control, continuous line), without Im (‘no Im’, dashed line) and with a −7 mV negative shift of the Im steady-state activation curve, i.e. resembling the retigabine effect (thin dotted line). Note that blocking Im or shifting its activation curve towards more negative potentials, increases and decreases the sAHP, respectively. B2 and B3, Im and Ih responses, respectively, during the protocol shown in B1. Insets show the open probability (Po) of Im (B2) or Ih (B3) during the AP. C, left panel, summary data of the mAHP amplitude at various holding potentials with or without sAHP current. Right panel, voltage dependence of the amplitude of the isolated mAHP (i.e. without sAHP current) with either Im or Ih blocked. D, voltage dependence of the Po (left) and time constant (right) of Im and Ih. Scale bar of insets in B1: 100 ms, 2 mV; B2 and B3: 0.5 ms, 20 mV.

