
Fig. 1.
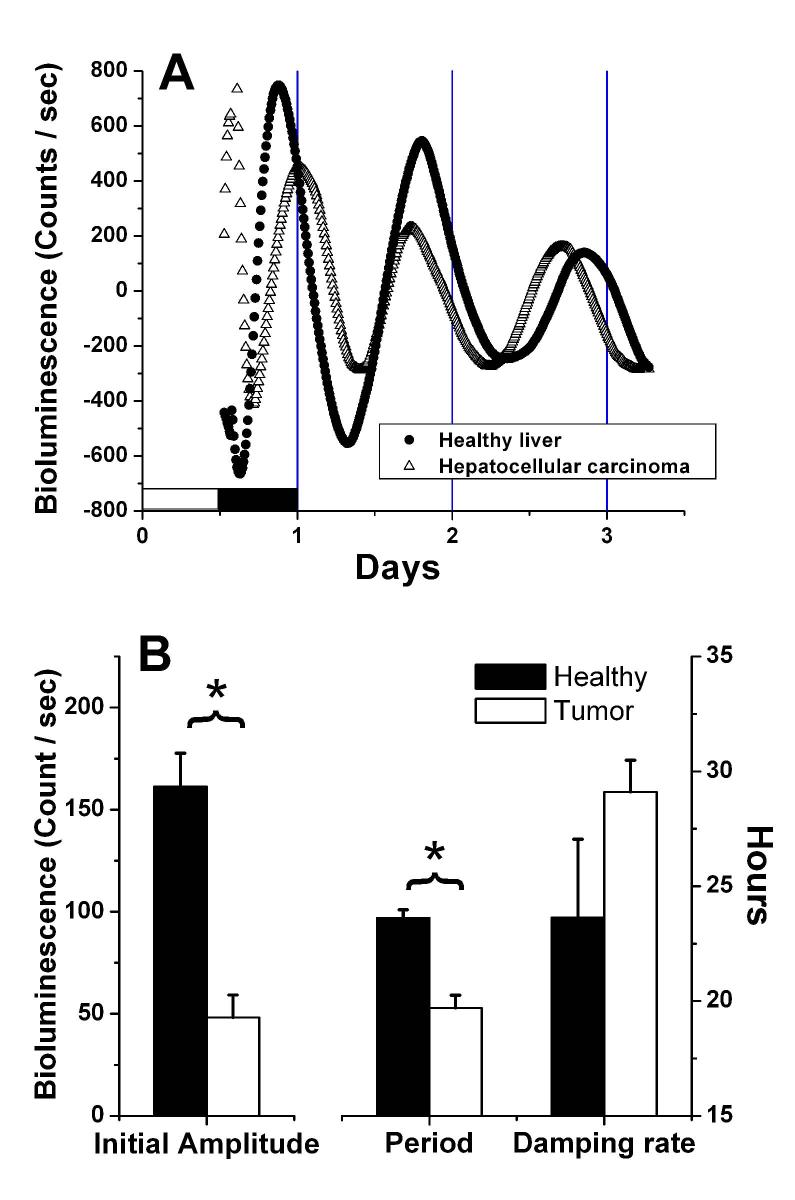
Bioluminescence measured in vitro from healthy liver and hepatocellular carcinoma tissue explants isolated from a PER1-LUC transgenic rat. A. Detrended bioluminescence counts smoothed with a 2h running average. The beginning of the record is the time of lights-on on the day of sacrifice, and the lighting cycle for that day is indicated by the white and shaded bars. The rat was killed about one hour before lights-off (ZT 11:00). B. Variance-weighted mean values for initial amplitude, circadian period and damping rate of healthy liver and hepatocellular carcinoma explants measured in vitro. Amplitude, in bioluminescence counts, is plotted on the left axis, while period and damping rate, in hours, are plotted on the right axis. * p<0.0001; Two-tailed Welch's t-test. Healthy n=14; Tumor n=21.