
Fig. 3.
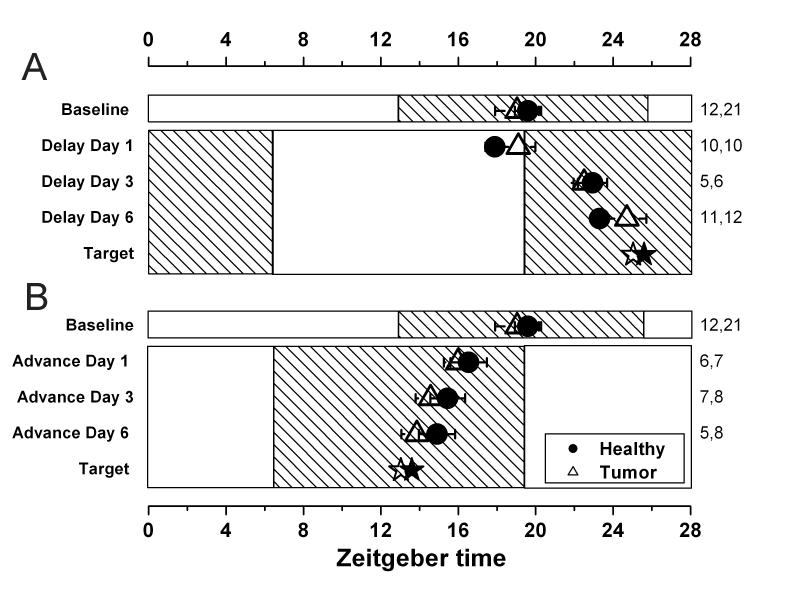
Photic resetting of healthy liver (closed circles) and HCC (open triangles). Mean ± SEM peak phase is shown for rats that have undergone a 6h phase delay (A), or a 6h phase advance (B) and then been killed for assessment of the circadian phase on either the first, third or sixth day in the new lighting conditions. The number of cultures that contribute to each datapoint are shown in the right margin (healthy, tumor). The hatching indicates the dark phase of the lighting cycle. The target, shown by a star, represents the theoretical phase of the tissue after the shift has been completed. It is calculated by adding or subtracting 6h from the baseline phase.