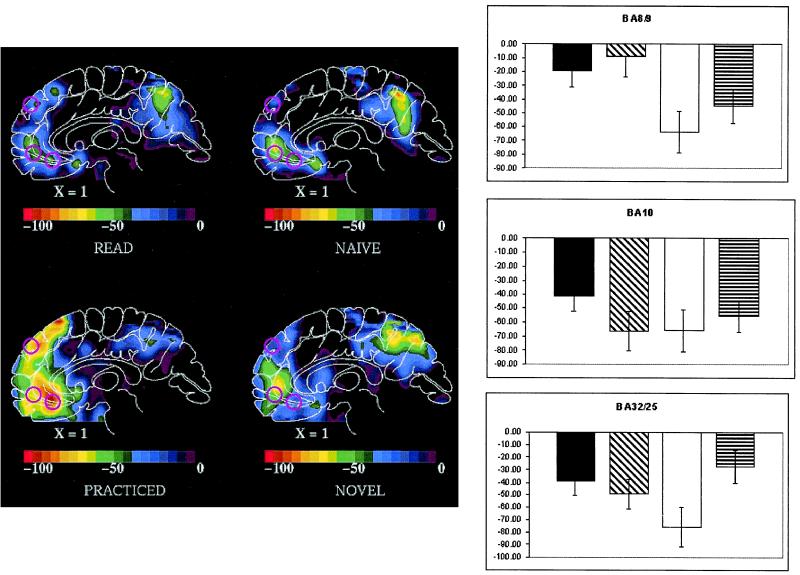
Figure 2.
(Left) Averaged subtraction PET images in atlas space (48) for each of the conditions examined. Upper Left, reading nouns aloud; Upper Right, naïve verb generation; Lower Left, practiced verb generation; and Lower Right, verb generation on a novel list of nouns. All comparisons are to passive viewing of nouns. Each image is a sagittal section taken 1 mm to the right of the midsaggital plane. Anterior is to the left. The color scale is a linear scale of normalized radioactive counts. The locations of the three MPFC regions studied are indicated with pink circles on each image. The ROIs are referred to by the BA originally assigned to them by Shulman and colleagues: BA 8/9 located at x = 5, y = 49, z = 36; BA 10 located at x = −1, y = 47, z = −4; and BA 32 located at x = 3, y = 31, z = −10. We note BA 32 most likely includes the adjacent BA 24 and 25 as well. (Right) Relative blood flow change (means ± SEM) in normalized counts within each region for each of the four comparisons: read = black bar; naïve = diagonal stripe bar; practiced = clear bar; and novel = horizontal stripe bar.

