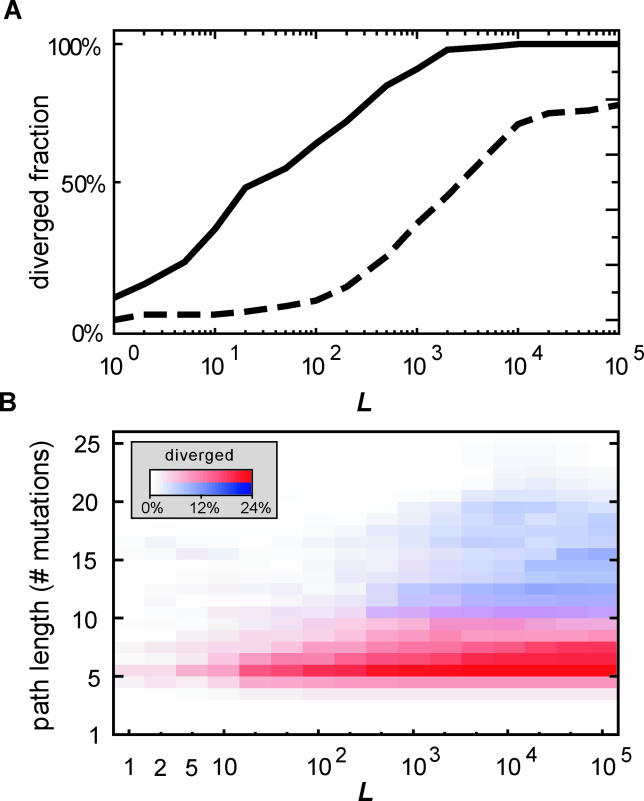
Figure 2. Divergence Success Ratio and Path Length Distributions.
(A) Fraction of starting sequences (numbering 132 in total) that successfully diverge, as a function of the number of networks carried to the next round (L). Dashed line, idem, but with the additional requirement of continued tight binding (F ≥ 100) for both repressors.
(B) Distribution of path lengths until divergence. Red color map, optimal co-divergence pathways. Blue color map, pathways with the additional requirement of F ≥ 100 for both repressors. Note that a vertical summation of the color maps yields the lines in (A).

