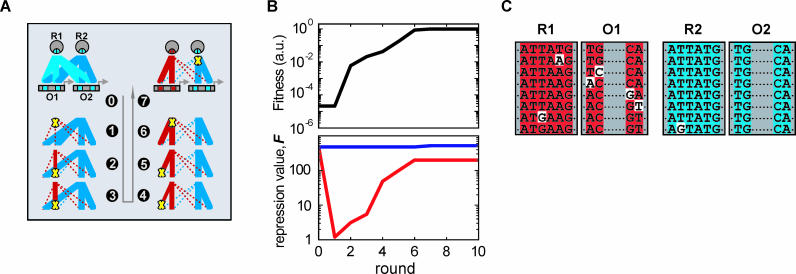
Figure 4. Typical Divergence Pathway: Network Changes, Fitness, and Sequence.
(A) Evolving interaction network, where line thickness denotes binding strength between repressor monomer and operator-half. Dotted lines denote negligible repression. Yellow crosses indicate repressor and operator mutations, which are positioned at the top and bottom of the interaction lines respectively.
(B) Fitness trajectory (black) and corresponding repression of each repressor on its operator (red and blue). Fitness is normalized to the maximum value (~1 ×10¹⁰).
(C) Sequences for each round. Mutated positions are colored white.

