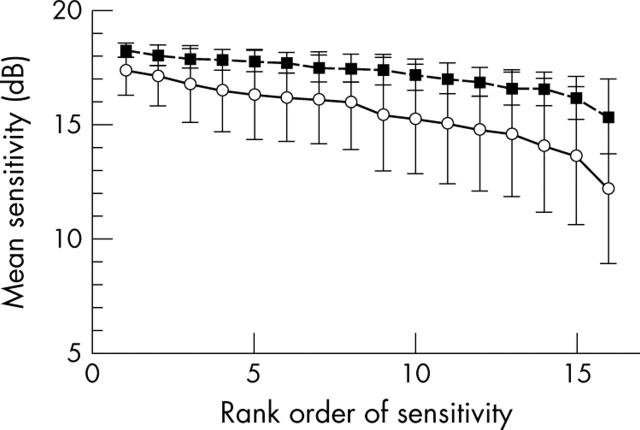
Figure 2.
Comparison of sensitivity between matched normal subjects and patients, plotted as means and standard deviations. The Bebié functions emphasise the difference between groups in overall sensitivity or diffuse loss, shown by the relative heights of the curves connecting the loci. The greater differences among loci is shown by the slope, with normals having a function with nearly zero slope, indicating little difference among loci, but patients having on average a negative slope, but with large individual differences. Solid lines, patients. Broken line, normals.

