
Fig. 5.
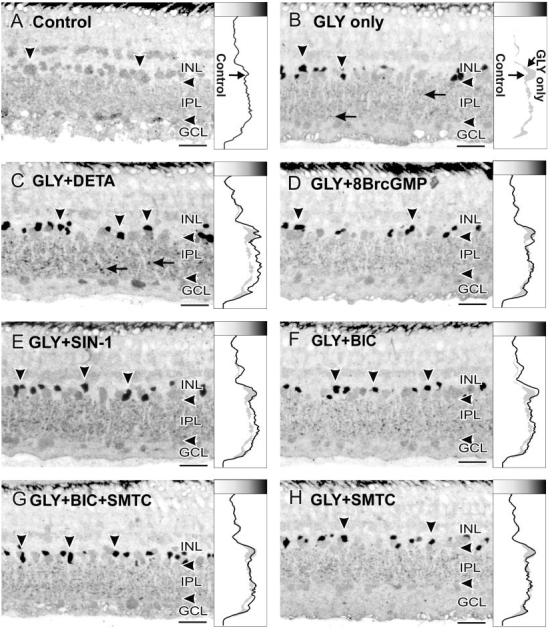
Glycine uptake experiments. In this figure and Figure 6, the vertical arrowheads indicate amacrine cell somata with GVG-LI, and the horizontal arrows indicate labeled boutons in the IPL. Higher GLY-LI levels are indicated to the right and as darker shades in the shade gradient box on top of the line profile curves. A: Retinas incubated with 5 mM sarcosine for 180 minutes were used as controls. Little GLY-LI was present after this treatment, and the line profile curve shows the background levels of GLY-LI. B: Reloading with GLY (1 mM) for 30 minutes dramatically increased GLY-LI in amacrine cell somata and in boutons in the IPL. The line profile curve shows increased levels of GLY-LI in the amacrine cell somata and in the IPL (right border of the gray shading in the curve box). C: Loading with GLY in the presence of 100 μM DETA increased the GLY-LI in the IPL and in amacrine cell somata in comparison with GLY loading only. D: Loading with GLY in the presence of 100 μM 8BrcGMP, however, did not mimic the effects of DETA, with the line profile curve roughly matching that seen with GLY loading only. E: Loading with GLY in the presence of 100 μM SIN-1 also raised GLY-LI above the levels seen with loading GLY alone, but more prominently in the IPL. F: Loading with GLY in the presence of 100 μM BIC mimicked the effects of DETA or SIN-1, with increased GLY-LI in amacrine cell somata and in the IPL, but the levels of increase in the IPL were not as great as those seen with DETA or SIN-1. G: Combining 100 μM SMTC with BIC, however, reduced the effects of BIC alone. H: SMTC alone did not enhance the loading of GLY. For abbreviations, see list. Scale bars = 25 μm.