
Fig. 9.
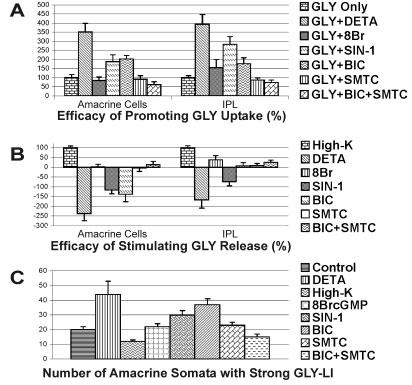
The area-under-the-curve (AUC) values for the amacrine cell somata and the IPL of the GLY-LI line profile curves. A: The efficacy of treatments in promoting GLY uptake were calculated based on the comparison of the difference in the GLY-LI AUC between untreated control retinas (0% uptake) and the retinas loaded with GLY (100% uptake); B: The efficacy in stimulating GLY release was calculated based on the comparison of the AUC difference between the GLY-loaded control retinas (0% release) and High-K-stimulated retinas (100% release); C: The amacrine cell somata count reflects the number of somata with strong GLY-LI in the INL seen with each treatment. The somata counts were obtained from images of retina that were matched in terms of their retinal location and the length of retina analyzed. For abbreviations, see list.