
Fig. 8.
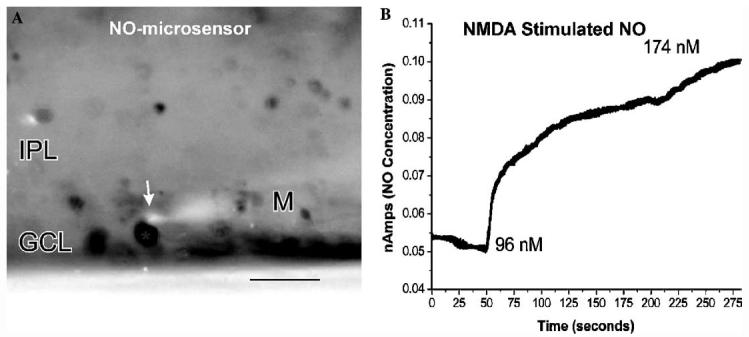
(A) Image of a NO selective microelectrode (M) with its sensor tip (arrow) placed adjacent to a ganglion cell with NO-IF in turtle. (B) Time-course of the increase in NO concentration measured with this microprobe. Before the application of NMDA the existing NO concentration in the region of this somata was ∼96 nM, while after the NMDA stimulation the concentration rose to ∼174 nM. Scale bar, 20 μm.