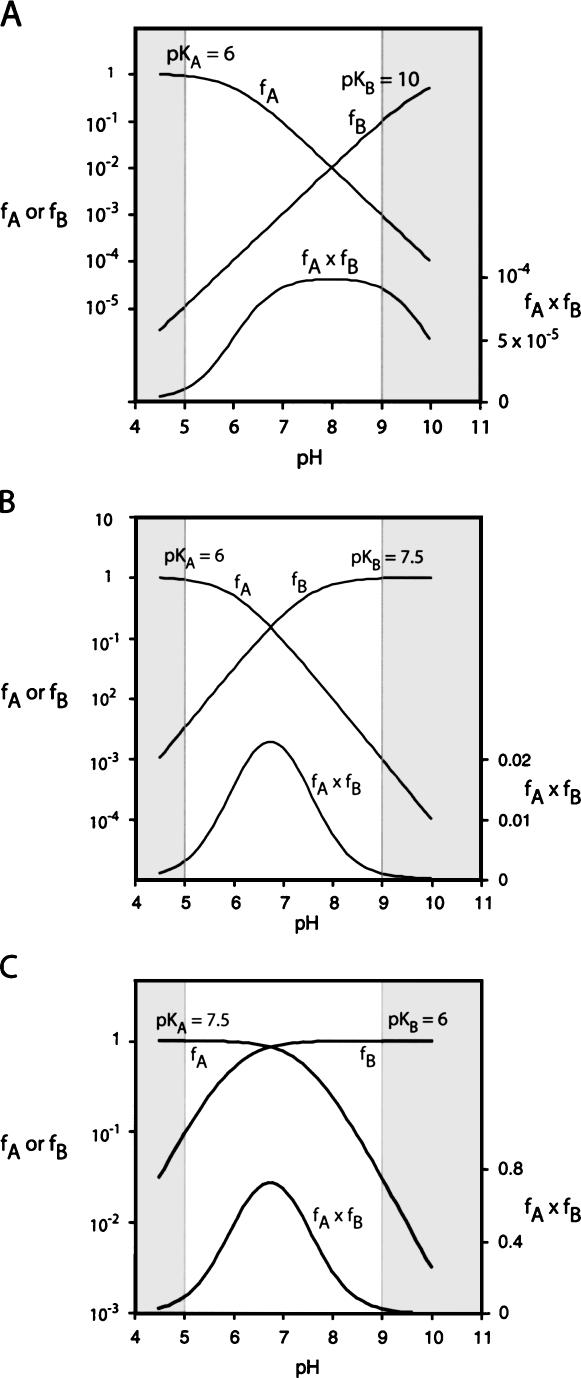
FIGURE 5.
Calculated pH dependence of the cleavage reaction of the hairpin ribozyme as a function of base pKA, assuming general acid–base catalysis. The fractions of protonated acid fA, unprotonated base fB, and their product fA·fB have been calculated and plotted as a function of pH, following the approach of Bevilacqua (2003). The sections shaded in gray are the extreme values of pH not accessible to experimental study. Reaction rate should be proportional to the fraction of ribozyme in the appropriate state of protonation, i.e., fA·fB. Note that in these graphs fA and fB are plotted on a log10 scale (left), while fA·fB is plotted on a linear scale (right). (A) Plot for pKA values of 6 and 10 for the acid and the base, respectively. This corresponds to the natural ribozyme, assuming A38 is the acid and G8 is the base. Reaction rate increases with pH until reaching a plateau value close to neutrality. (B) Plot for pKA values of 6 and 7.5 for the acid and the base, respectively. This corresponds to that expected for a ribozyme in which G8 has been substituted by a base with a pKA of 7.5. A bell-shaped pH dependence is now expected. (C) Plot for pKA values of 7.5 and 6 for the acid and the base, respectively. This corresponds to that expected for a ribozyme in which G8 has been substituted by a base with a pKA of 7.5, now acting as the acid in the reverse reaction. Note that the shape of the pH profile is the same as that for the cleavage reaction.

