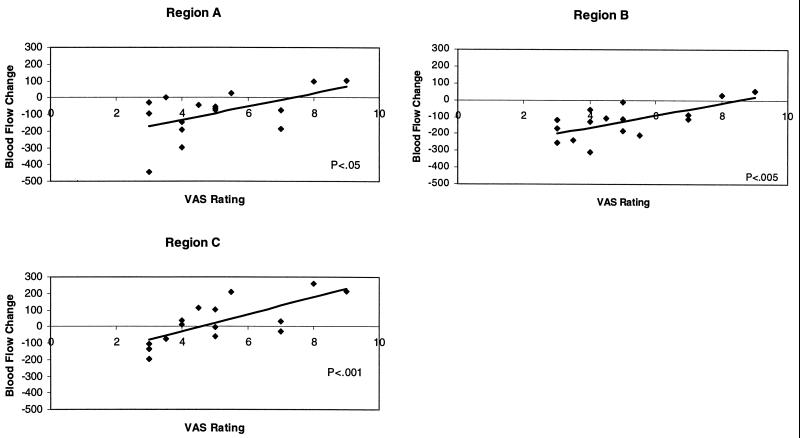
Figure 4.
Scatter plots of VAS used for the assessment of anxiety during the anticipation of an electric shock on the hand vs. BF change in the regions identified in the averaged subtraction (regions A and B, Fig. 2.) and covariance (region C, Fig. 3) images. The Blood Flow Change scale is a linear scale of normalized radioactive count differences.

