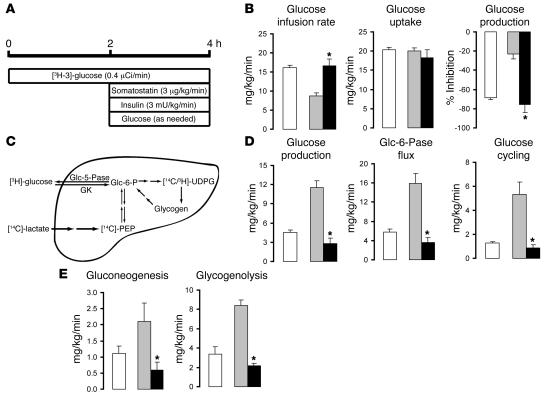
Figure 3. Scd1 deficiency negates the effects of OF on hepatic glucose fluxes.
(A) Protocol for the hyperinsulinemic-pancreatic clamp procedure. (B) Glucose infusion rate, glucose uptake, and inhibition of glucose production (expressed as percentage inhibition from basal) during the clamp period in SC (white bars), control OF (gray bars), and Scd1-deficient OF animals (black bars). (C) Schematic of the major pathways and enzymatic reactions contributing to glucose production in the liver. [14C]-PEP, 14C-phosphoenolpyruvate; 3H/14C-UDPG, 3H/14C-UDP glucose; GK, glucokinase. (D) Glucose production, Glc-6-Pase flux, and glucose cycling during the clamp period in control SC (white bars), control OF (gray bars), and liver Scd1–deficient OF animals (black bars). (E) Rate of hepatic gluconeogenesis and glycogenolysis in control SC (white bars), control OF (gray bars), and liver Scd1–deficient OF animals (black bars). *P < 0.05, versus SCR ASO OF; n = 5–6 per condition.

