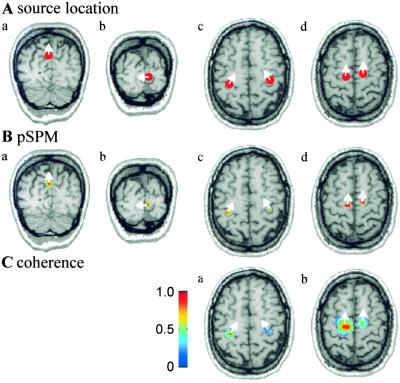
Figure 1.
Simulations. (A) Locations of simulated sources are indicated as red dots on coronal (a and b) and axial (c and d) MR images. (B) pSPMs calculated in the frequency bands 7–9 Hz (a), 11–13 Hz (b), 20–24 Hz (c), and 17–19 Hz (d). The threshold for the pSPMs corresponds to P < 0.001. (C) Coherence estimates are shown with a threshold of 0.23 in the frequency bands 9–11 Hz (a) and 17–19 Hz (b). The reference point in a was the left hand area, as estimated from the pSPM, and in b the left premotor area. Coherence of the reference region with itself is always equal to 1. The white arrows indicate the dominant direction of current flow.

