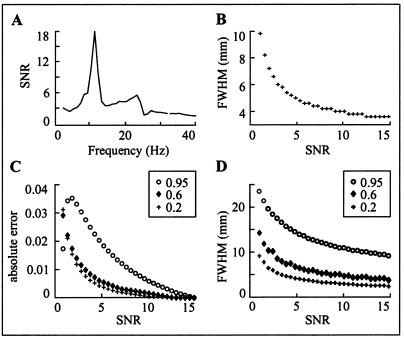
Figure 4.
Testing the performance of DICS. (A) The SNR of spontaneous activity, estimated as the ratio of the frobenius norms of the cross spectral density matrices of data measured from a resting subject (signal) and without a subject (noise). (B) The pSPM FWHM in millimeters plotted for SNR in the range 1 to 15. (C) The absolute error in the coherence estimation for three different coherences (0.2, 0.6, and 0.95) is plotted as function of SNR. (D) The dependence of FWHM of coherence on SNR for three different coherence values (0.2, 0.6, 0.95).

