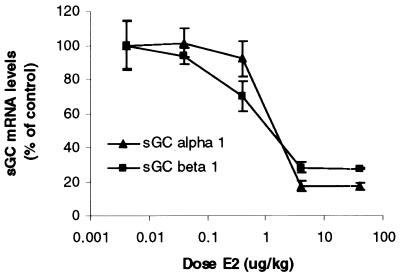
Figure 2.
Dose-dependent reduction of sGC α1 and β1 transcripts by E2. Increasing doses of E2 were administered to ovariectomized animals that were killed after 3 h. Uterine sGC mRNA levels were determined by real-time Q-PCR. Mean values ± SEM (Con, n = 6; all doses, n = 3) were normalized to 36b4 and graphed as percent of control.

