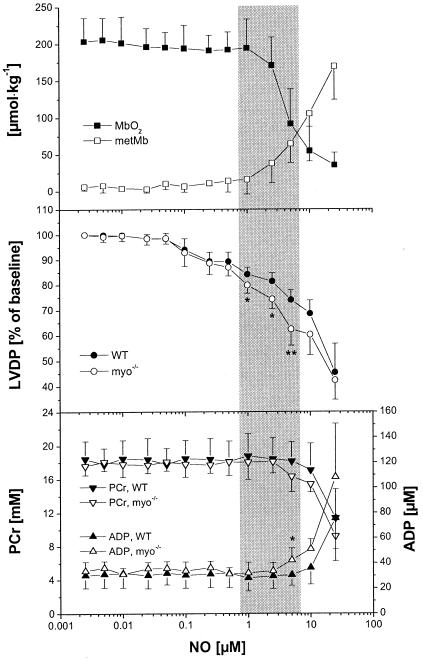
Figure 2.
Analysis of cardiac Mb (Top), function (Middle), and energetics (Bottom) of isolated perfused hearts with increasing NO concentration. Symbols show means ± SD for n = 8 hearts; * = P < 0.05; ** = P < 0.01; For abbreviations see Fig. 1. The shaded area emphasizes the association of metMb formation in WT hearts and the more pronounced impairment of cardiac function and energy status in Mb-deficient as compared with WT hearts.

