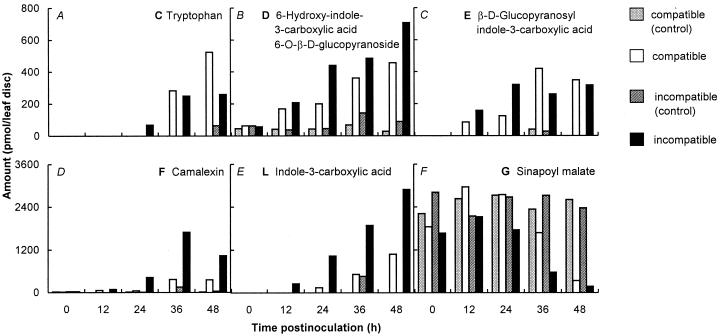
Figure 4.
Timing of product accumulation (A–E) or disappearance (F) in infected A. thaliana leaves. HPLC profiles analogous to those shown in Figs. 1 and 2 were established for all time points given and used for quantification of the indicated compounds. Bars represent data from Pstc control (white) or infected (light gray) and Psti control (dark gray) or infected (black) leaf discs. All data are mean values from two independent experiments.

