Figure 2.
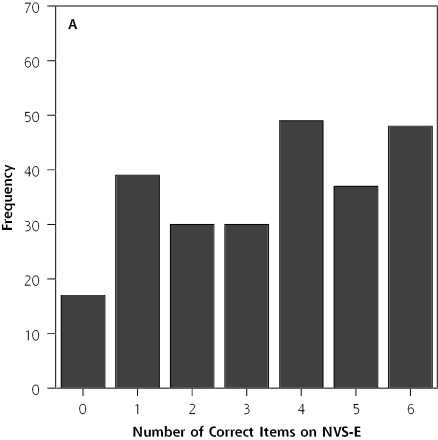
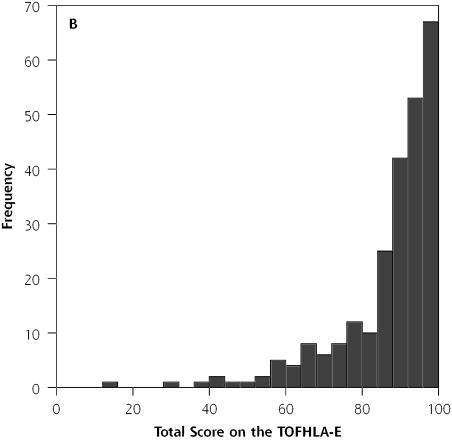
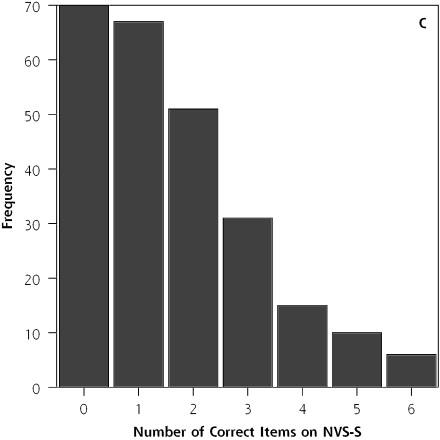
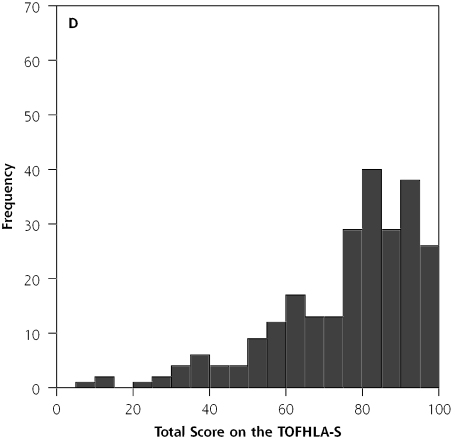
Distribution of scores on the Newest Vital Signs (NVS) and the Test of Functional Health Literacy in Adults (TOFHLA).
Note: Histograms on top show the distribution of participants’ scores on (A) the English version of the Newest Vital Sign (NVS-E) and (B) the English version of the Test of Functional Health Literacy in Adults (TOFHLA-E). Histograms on the bottom show the distribution of scores on (C) the Spanish version of the Newest Vital Sign (NVS-S) and (D) the Spanish version of the Test of Functional Health Literacy in Adults (TOFHLA-S).


