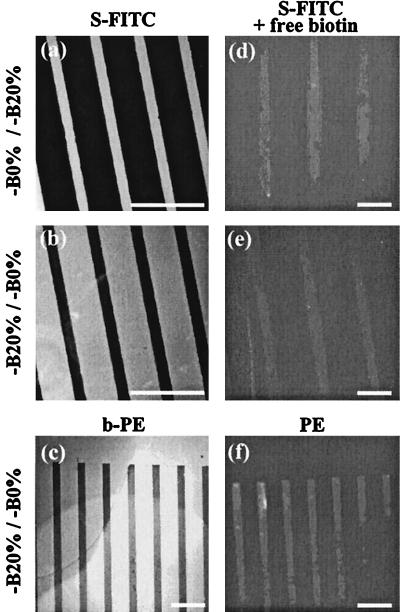
Figure 5.
Fluorescence microscopy images of streptavidin-FITC bound to patterned PLL-g-PEG(-biotin) surfaces. In a and b, the patterned surface was incubated with S-FITC; in d and e, it was incubated with S-FITC diluted in a 1000× molar excess of free biotin. Contrast and brightness had to be adjusted. In c and f, the patterned surface was incubated first with streptavidin and then with biotinylated phycoerythrin (b-PE) (c) or phycoerythrin (PE) (f). (The scale bar is 100 μm.)

