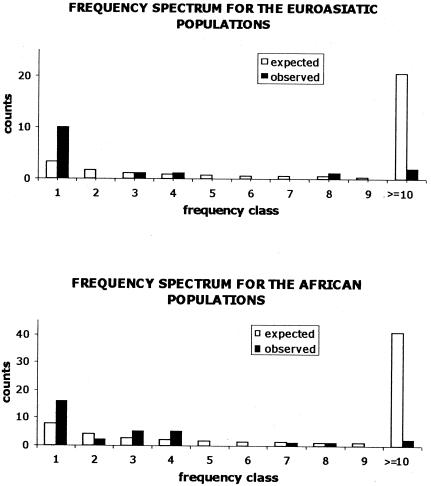
Figure 2.
Frequency spectra for the populations grouped by continent. The frequency class represents the number of segregating sites for which the mutant form is present in i copies and the ancestral estate in n − i copies, with i ranging from 1 to n − 1 and n being the total number of sequences. As the ancestral state has been inferred, these frequency spectra are unfolded, that is, classes (i, n − i) and (n − i, i) can be distinguished. For convenience, frequency classes from i = 10 to n − 1 have been grouped together. Expected values under neutrality and constant size were obtained by using equation 51 in ref. 27.

