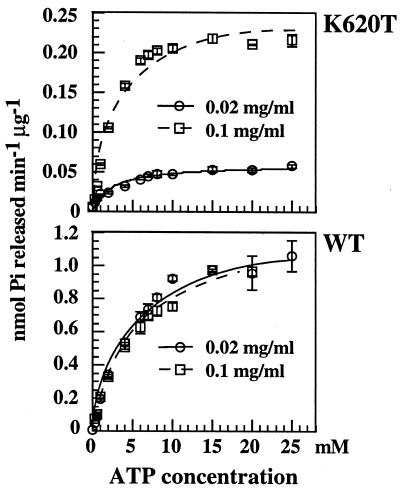
Figure 3.
Kinetic analysis of ATP hydrolysis. K620T and WT proteins at different protein concentrations. Phosphate released was determined after 4 min at the high protein concentration (0.1 mg/ml) and after 16 min at the low protein concentration (0.02 mg/ml) to ensure that reactions were within the linear range of the assay. Assays were performed in the same buffer as cross-linking studies (Fig. 1A) at 37°C. The rate of hydrolysis was calculated from the nanomoles of phosphate released by 0.5 μg of Hsp104 (0.02 mg/ml) during the first 5 min of incubation with ATP at various concentrations. Km and Vmax values were determined by least squares fitting to the Michaelis–Menten equation by using the Kaleidagraph program (Synergy Software). Kinetic properties of the WT protein are similar at both protein concentrations, but for the K620T mutant Vmax values increased 4-fold at the higher protein concentration.

