
Figure 4.
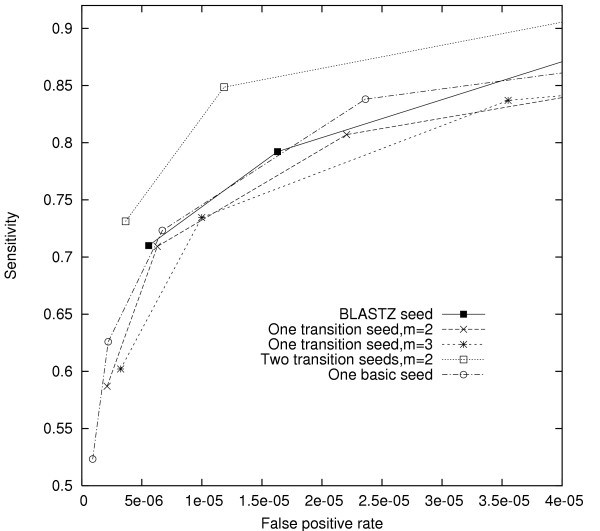
Comparison of transition seeds on EST sequence alignment. Each ROC curve shows seeds with the same transition weight m but different match weights w. Each curve starts with a seed with w + m = 11 and then decreases w while holding m constant. Each point represents a locally optimal set of seeds. A ROC curve for single basic seeds is also plotted for a comparison.