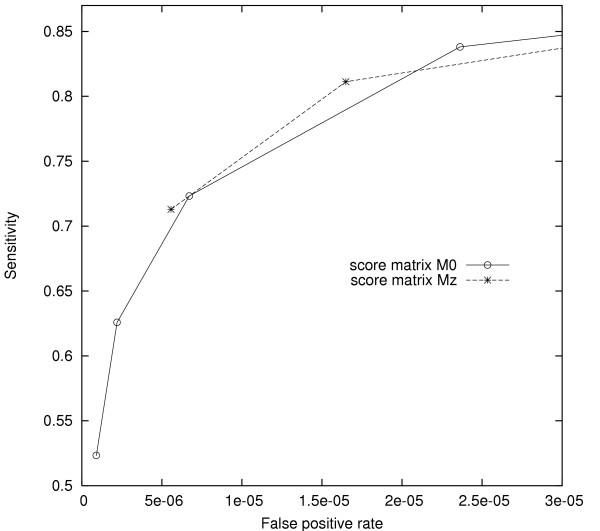
Figure 5.

Comparison of score seeds on EST sequence alignment. Comparison of score seeds on EST sequence alignment using different score matrices (M0, Mz). The leftmost seed on each ROC curve has weight 11, while subsequent seeds decrease w by one. Score thresholds were chosen to produce similar fp rates for seeds of the same weight.
