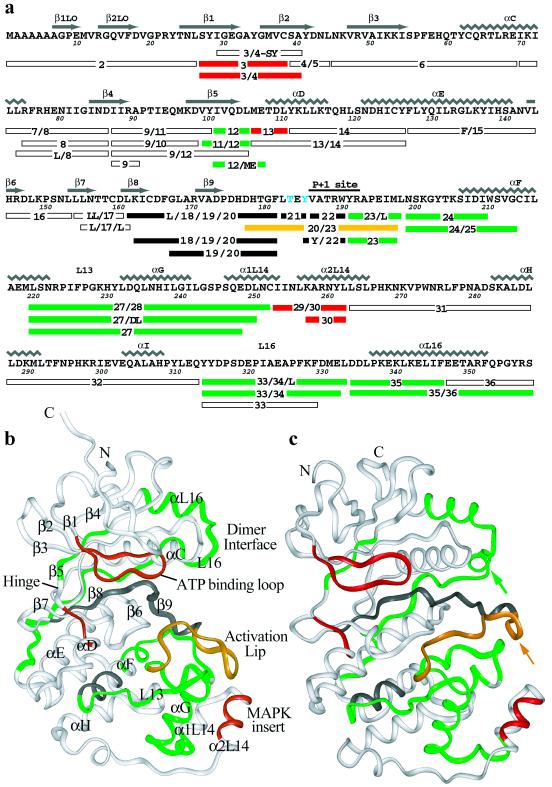
Figure 1.
Peptides analyzed in this study. (a) Sequence coverage of ERK2 indicating residue numbering and secondary structure as in Zhang et al. (2). Peptides colored red, green, yellow, or white showed HX rates that, respectively, increased, decreased, both increased and decreased, or did not change upon kinase phosphorylation. Peptides recovered only from unphosphorylated ERK but not ppERK are shown in black. Residues phosphorylated in ppERK are shown in blue. (b) Structural representation of ERK (2). Sequences not recovered from peptide digests are colored gray. (c) Structural representation of ppERK (3) as in b, rotated slightly clockwise (as viewed down the vertical axis) to more clearly show the major differences with the inactive form, the reorganization of the activation lip (yellow arrow) and the formation of a 3/10-helix near the C terminus (green arrow).

