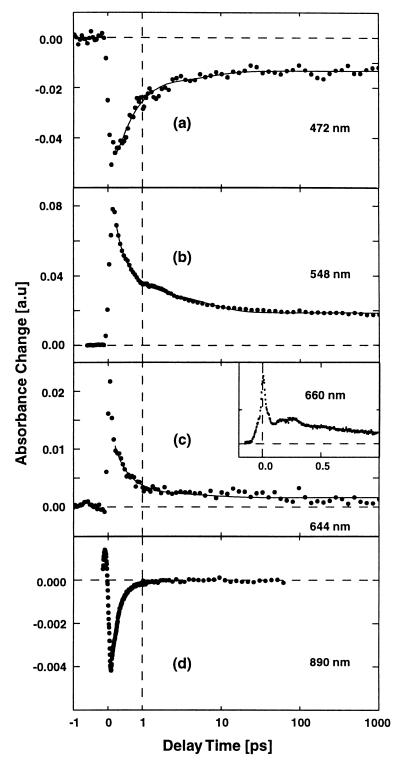
Figure 2.
Transient absorption changes of pSRII after excitation with 480-nm (multichannel detection, a–c) and 530-nm pulses (single-channel detection, c Inset and d) displaying the femtosecond and picosecond reaction dynamics. The solid lines represent the results from a multiexponential global fitting procedure with time constants of τ1 < 150 fs, τ2 = 300–400 fs, τ3 = 5 ps, and τ4 = ∞. Note the linear time scale for delay times < 1 ps and the logarithmic scale at later delay times.

